Bittium SafeMove® Analytics - Know the Status of Your Mobile Device Fleet

Intelligent Tool for Analyzing Device and Connectivity Performance
Are you aware of where and when your organization’s devices are used and what kind of connectivity performance they have? Do you know to what extent your users have embraced mobile working practices? Are your users making good use of all connectivity opportunities provided by the business? Bittium SafeMove® Analytics can answer all of these questions and more. SafeMove® Analytics is an intelligent tool for monitoring and analyzing device utilization and the performance of wireless networks. Real-time and historical information about the device fleet’s whereabouts and connectivity status helps you understand where, when and how your devices are being used. Relevant, accurate data allows making fact-based decisions in order to improve business efficiency and user experience.
Improved Productivity
With data that enables fact-based decision making
Tailored for Your Needs
Dynamic web UI for views and reports tailored to your needs
Improved Troubleshooting
Accurate data enables proactive response to connectivity issues
Real-Time & Historical Data
Location and connectivity status of your device fleet

“Reliable, easy-to-use field connectivity is key to our mobile workforce. The Bittium SafeMove solution gives us unprecedented visibility into the performance of our ToughPad devices and the available networks allowing our team to optimize device settings and select the best networks available. With connectivity now above 95% we are seeing significant improvement in our service levels.”
ADRIAN CAPP, MOBILE SYSTEMS MANAGER, UK POWER NETWORKS
Mobile Performance Solution for Your Device Fleet
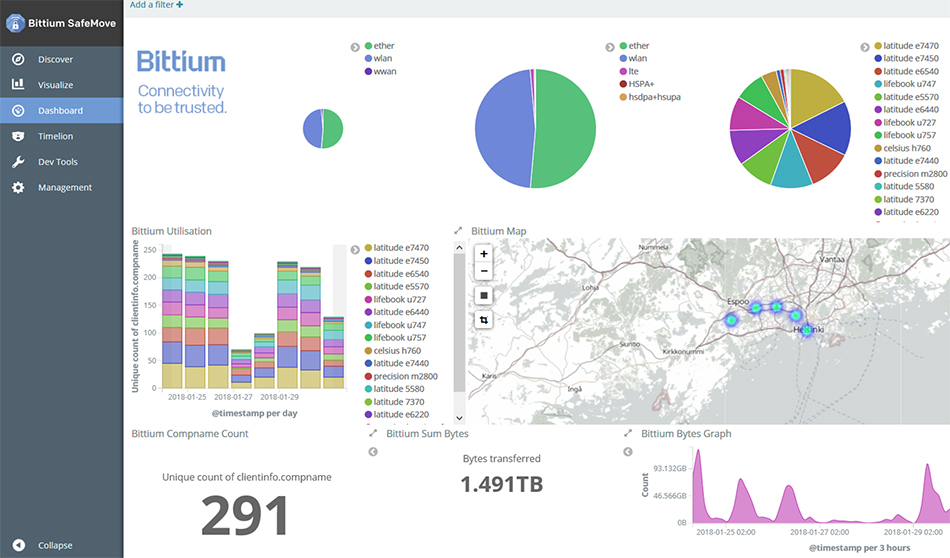
Bittium SafeMove® Analytics collects connectivity, location and usage data, processes it and presents it in an easy-to-use web UI. The web UI comes with a set of pre-defined dashboards that give you an overview of the connectivity status and utilization of your entire device fleet.
- Full control to customize visualizations
- Create new dashboards
- Drill down to data of an individual device, for example status and location of the user that reported connectivity issues last Wednesday
- Create reports, for example to compare your new devices to the old device fleet
Analytics will support you regardless of what you need to understand about your device fleet and its connectivity. There are also interfaces to integrate the analytics data into existing tools such as Microsoft Power BI.
Usage Examples

Predict & Measure
Predict and measure the effects of new connectivity options, for example subscribing to a public Wi-Fi service in addition to cellular connectivity.
Compare Data
Let individual managers and team leaders measure connectivity performance of their teams, display trends and compare against other teams.
Identify Issues
Identify “notspots” and eliminate them by providing alternative coverage.
Confirm Correct Device Use
Understand if mobile devices are utilized in the way envisioned by management.
Recognize Training Needs
Identify teams and individuals most in need of training in order to allow them to adapt to mobile working procedures.
Visualize & Playback
Visualize and playback device tracking information and network performance on an interactive map.

Materials
Datasheets
Customer Success Stories
Contact Us
Microsoft and Power BI are trademarks of the Microsoft group of companies.